
- May 11, 2026
- AD Staff Writer
- News
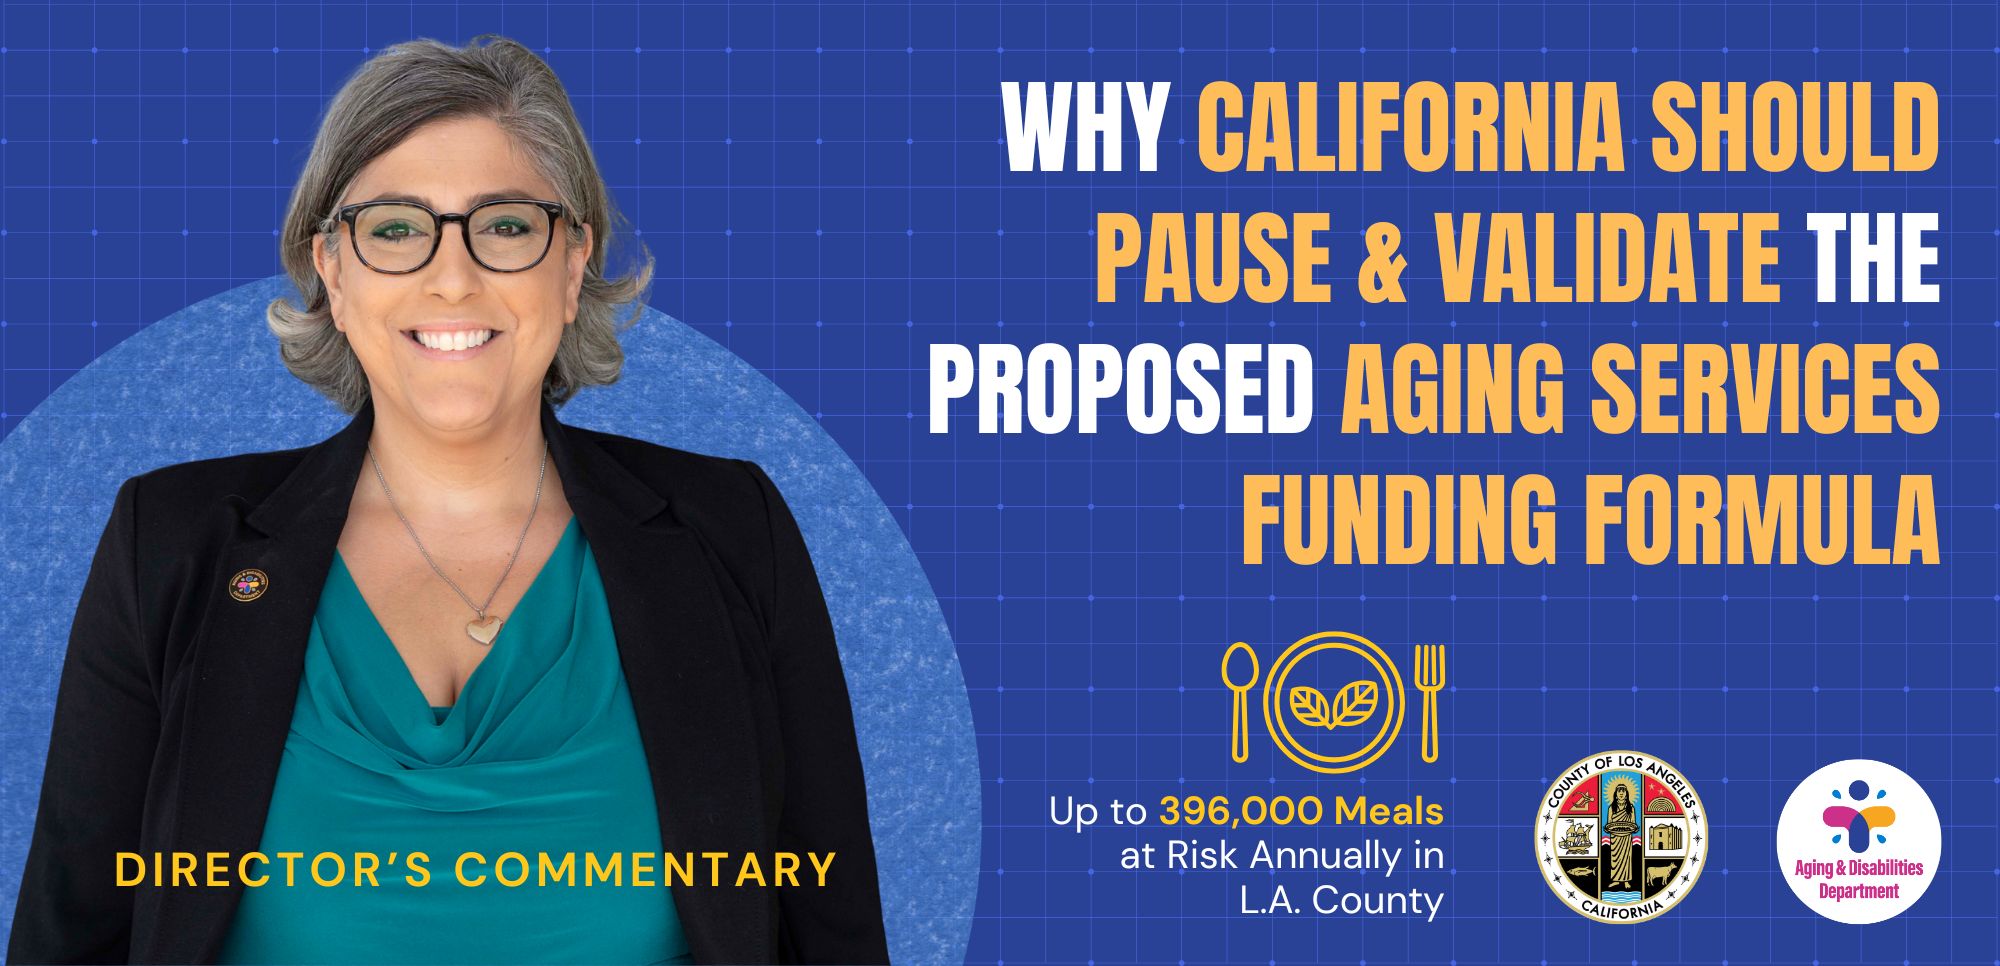
Director’s Commentary: California Must Rethink Its Aging Funding Formula
California is on the verge of making a well-intentioned but deeply flawed policy shift, one that risks destabilizing services for older adults in the very communities where need is greatest.
At issue is the proposed Intrastate Funding Formula (IFF) redesign led by the California Department of Aging. While the goal is to modernize how funds are distributed across Area Agencies on Aging (AAAs), the current proposal would result in significant funding losses for high-need regions like Los Angeles County, with reductions projected in the millions.
This is not simply a technical adjustment. It is a structural redistribution with real consequences.
The Problem: Equal Weighting vs. Real-World Need
Los Angeles County serves the largest older adult population in the state, approximately 25% of Californians over age 60, along with one of the highest concentrations of low-income seniors and a rapidly growing population of older adults with complex needs.
The revised formula does not introduce new demographic factors. It relies on the same core indicators: age, income, disability status, geographic isolation, and minority populations. The change is in how those factors are weighted. Under the proposed approach, these variables are weighted evenly, rather than emphasizing the factors most closely correlated with need, particularly low-income older adults.
On paper, equal weighting may appear more balanced. But in practice, it creates a critical distortion: not all factors drive service utilization at the same magnitude or scale. Low-income older adults are significantly more likely to rely on publicly funded nutrition and supportive services. High population density increases total service volume and system strain. By flattening the weighting across variables, the formula reduces emphasis on high-demand, high-utilization populations, effectively redistributing resources away from areas where services are most heavily used.
The issue is not what is being measured; it is how those measures are weighted. Equal weighting may look fair on paper, but it fails to reflect how need manifests in real communities. The data also shows that population growth is not occurring evenly across the state. Los Angeles County alone added more than 92,000 older adults in a single year, yet the proposed formula does not proportionally reflect that increase.
PSA 19 alone added more than 59,000 older adults in one year—far exceeding the total population change of multiple rural regions combined.
A 5% increase in a county of 7,000 is not equivalent to a 4% increase in a region of more than one million, yet the formula treats them similarly. If funding is intended to follow need, it must align with where growth is actually occurring. In practice, this shift toward equal weighting has the effect of redistributing resources toward smaller and less densely populated regions, where service systems operate at a different scale.
While those regions face real and important needs, a proportional model without adjustment for population size and service volume does not adequately account for the intensity of demand in large urban systems, resulting in reduced funding where the majority of services are delivered.
What This Means for Older Adults
A funding reduction of this magnitude does not result in abstract budget adjustments. It translates directly into lost services. In Los Angeles County (Planning and Service Area 19), applying a proposed 17% reduction across all programs including nutrition funding results in an estimated:
~185,875 fewer congregate meals annually
~157,000 fewer home-delivered meals annually
~342,000 total meals lost each year
That equates to more than 1,300 fewer meals every single day
These are not marginal reductions. They represent a substantial contraction in the state’s largest aging services system.
And the impact is not evenly distributed. Congregate meal reductions weaken community-based access points and social connection. Home-delivered meal reductions disproportionately affect homebound, medically fragile older adults with no alternative access to food.
The downstream consequences are predictable: increased malnutrition, higher rates of hospitalization, greater likelihood of premature institutionalization.
Where the Formula Falls Short
The fundamental issue with the current IFF proposal is that it prioritizes formulaic balance over operational reality. Not all regions are interchangeable. Not all systems operate at the same scale. And not all communities face the same level of demand.
While the formula includes relevant demographic indicators, it does not sufficiently account for actual service utilization, caseload volume, waitlists, unmet need, or the cost of delivering services in high-density, high-cost environments.
A formula that does not incorporate real demand risks misallocating resources no matter how refined its inputs appear. When weighting does not reflect real drivers of demand, funding follows the formula, not the need.
This dynamic is not unique to Los Angeles County. Other large, high-demand regions face similar structural risks under this approach.
Why Large Counties Face Different Challenges
Supporters of the revised formula may argue that regions like Los Angeles County are better positioned to absorb funding reductions due to our size, infrastructure, or access to other resources. But this misunderstands how aging services are funded and delivered.
The very funds the California Department of Aging wants to reallocate away from Los Angeles County are restricted in use, not interchangeable with general fund dollars, and not easily backfilled without policy changes and competing budget tradeoffs. Similarly, higher service costs in urban regions are sometimes interpreted as inefficiency. They reflect higher labor costs, transportation and logistical complexity and facility and operating expenses in high-cost markets. Higher cost does not indicate inefficiency; it reflects the true cost of delivering services at scale in complex environments.
Finally, while phased implementation has been suggested as a mitigation strategy, even gradual reductions create immediate operational consequences. Nutrition programs operate with limited elasticity. Capacity is directly tied to funding, and reductions translate quickly into fewer meals and longer waitlists.
An Alternative Path Forward
Modernization is necessary, but it must be done responsibly. A more viable approach would include:
1. Hold Harmless Provisions. Ensure that no region experiences sudden funding losses that destabilize services.
2. Phased and Conditional Implementation. Tie implementation to demonstrated system readiness and impact monitoring.
3. Incorporation of Service Utilization Data. Weight funding based not only on demographic indicators, but also service delivery metrics and cost per service in high-density regions
4. Regional Cost Adjustments. Recognize the higher cost of delivering services in urban, high-cost areas like Los Angeles County.
5. Baseline Infrastructure Protection. Ensure that large systems with existing capacity are not weakened in the name of redistribution.
Why Getting This Right Matters
California has made strong commitments to aging policy through initiatives like the Master Plan for Aging. These efforts prioritize aging in place, equity, and access to services. But those goals cannot be achieved if the funding structure undermines the systems responsible for delivering them.
If fully implemented, the current proposal risks reducing service capacity in the state’s highest-demand region by over 300,000 meals annually at a time when need is growing, not shrinking.
This creates a paradox: a more “equitable” formula that produces less equitable outcomes.
A Chance to Get This Right
This is not an argument against change. It is an argument for getting it right.
State leaders, policymakers, and stakeholders must pause and reassess the current approach. The goal should not simply be redistribution; it should be maximizing impact where need is greatest.
Because at the end of the day, this is not about formulas.
It is about whether an older adult receives a meal. Whether a caregiver gets support. Whether a system can continue to function under increasing demand.
California has the opportunity to lead. But leadership requires precision, not just intention.
Maral Karaccusian, Director, L.A. County Aging & Disabilities Department